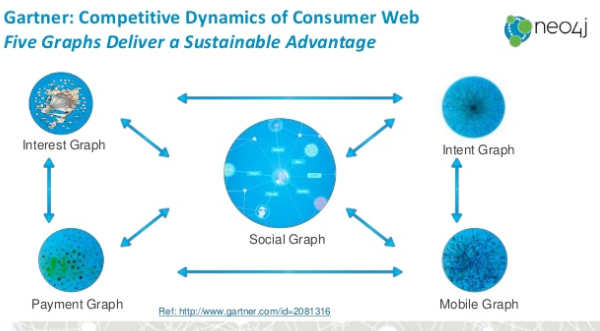
We are witnessing the rise and adoption of graph databases across different verticals. Gartner acknowledged the five different types of graphs as social, intent, consumption, mobile and interest. In a presentation titled: Graph All the things! Introduction to graph databases, the team from Neo4j captured Gartner’s graph classifications in the illustration below. There is a slight difference in how one of the types of a graph is named by Neo4j in comparison to Gartner. To Neo4j it is a payment graph while to Gartner it is the consumption graph. There is the argument that a consumption graph is a better name as we do not necessarily pay for every consumption. We will now look at each graph and add some additional types.
Types of graph
Gartner argues that consumer online space is congested and full of complex dynamics. They identified the top four companies dictating the space and the graph data models. These companies are Amazon, Facebook, Apple and Google. Whilst I share the same sentiment with Gartner regarding the top players, I do believe that graph data models will not only be applicable to the consumer sphere but also the B2B segment. We will be looking at the five graphs identified by Gartner and also include additional graphs.
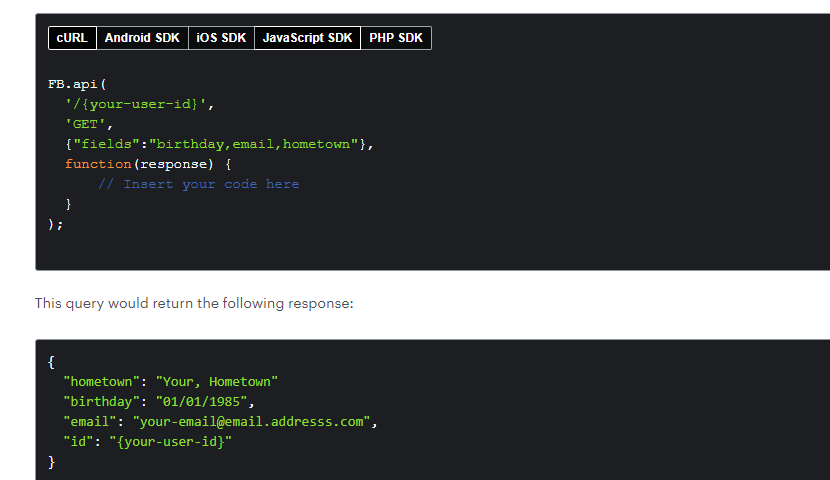
1) The Social Graph: Social media platforms such as Facebook have made the social graph quite popular. It is adapted from graph theory and refers to the overall mapping of people and how they are related. Facebook brought this concept to light during the 2007 Facebook F8 conference. They have created a GraphAPI that allows developers to read and write to Facebook’s social graph. Developers can request for accessibility tokens for the type of field or user data they may require. Facebook put together a user node reference that guides developers on fetching fields from the user level. In the image below, a user ID, birthday, email and hometown are being fetched via a JavaScript SDK.
The above may apply to developers but there are several articles on the web that sheds some light on the concept of the social graph. The Harvard Business Review emphasizes how third party companies like TripAdvisor use Facebook’s social graph to ensure the prominent reviews you see are those from people that are connected to you. With Facebook’s graph setup you’ve got nodes, edges and fields (properties). The nodes are usually individual objects such as a comment, page, user or a photo. The edges indicate the applicable connections to the node like all the comments on a video or a photo. While the fields are the properties of a node e.g date of birth and hometown of a user.
2) The Consumption graph: This is also viewed as Payment Graph and it is more achievable within walled transactional gardens like Amazon, eBay and Paypal. With the European GDPR laws and the competitive advantage of storing users consumption data, the graph models for transactional behaviours can easily be implemented by these eCommerce giants. Credit card companies, traditional and challenger banks can also develop a consumer graph. This is why a credit card company like Mastercard can develop a city index by the amount spent by travellers. Also, retail outlets with an eCommerce presence can build a consumption graph of customers to power a recommendation engine or a loyalty programme. Proprietary or first-party customer data is quite crucial to building out a consumption graph.
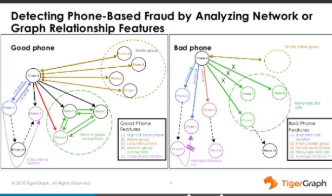
3) Mobile Graph: The mobile graph is not how mobile phones are connected but the data footprint from mobile devices. It is quite known that the majority of the data comes from mobile phones but IoT or M2M devices generate some amount as well. Mobile grah maps the engagement with different apps and shared contextual information such as timestamp and location. Some of these mobile interactions can also consist of check-ins via location-based apps, bookmarking web pages, digital payments, video recording and conferencing. There are a lot of actions on mobile devices that can play the role of an edge in a graph and the apps becoming the nodes. A presentation from TigerGraph indicates how mobile graphs can help detect phone-based fraudulent activities. As the diagram below differentiates a good phone from a bad phone behaviour. Brief calls, no call back function and many rejected calls can indicate a fraudulent mobile graph.
4) The Interest Graph: This type of graph is viewed as an online reflection of the things people have interest in. The music band pages we like on Facebook, concert tickets we purchase from Ticketmaster and questions we put forward on Reddit or Quora indicates our interest. This interest can be contained in a single ecosystem like Facebook, Amazon or Google. Or, it could be across a variety of platforms which might make it difficult to syndicate all of these digital footprints to better capture the interest of the user. Interest graphs should not be mistaken for social graphs, as they are two different concepts. Social graph focuses more on how people are connected while the interest graph looks at the relationship from what people like or have more receptivity for in the real world. The pages people like, comment on, their searches, ads they interact with and the property details on their Facebook page such as favourite books and music. The Interest graph is useful in personalising the web experience of users through tailored advertising, friend and product recommendations.
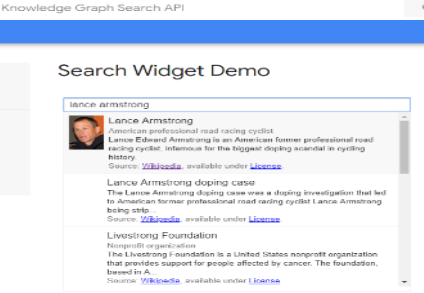
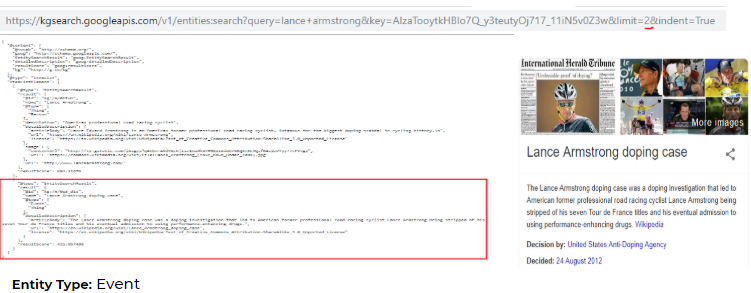
5) Knowledge Graph: The term Knowledge Graph was popularised by Google. It refers to an automated way of representing a knowledge domain with the assistance from thought leaders or experts of a given field. Google has developed a knowledge graph that uses information from around the web to represent entities such as books, events, movies, person, place and a few more. The linked data following a Schema helps Google improve search results for users. Google has provided an entity search widget which helps you understand the number and hierarchy of entities linked to a principal entity or search term. Using the tool to search for the entity Lance Armstrong, it revealed linked entities such as Lance Armstrong (Person), Lance Armstrong doping case (event) and Livestrong Foundation (organisation).
Developers can use an API key with their language of choice to make a read-only request of entities stored on Google’s Knowledge Graph. The below code fetches the second linked entity to Lance Armstrong which happens to be his doping case (event).
6)The Commonsense Knowledge Graph: This is taking knowledge graphs to a deeper and contextual level. Mark Riedl views commonsense knowledge as the set of social and culturally shared beliefs about how the world functions. Wikipedia conceives of commonsense reasoning as the assumptions about the physical properties (folk physics) and intentions (folk psychology) of objects and people. ConceptNet is one of the leading common sense knowledge bases that emerged from a crowdsourcing project known as Open Mind Common Sense. Commonsense Knowledge Graphs are important in improving query understanding in search engines and dialogue systems.
7) Intent Graph: This is one of the five graphs shared in the Gartner research. Gartner states Intent graph focuses on reasoning and motivation. In the field of digital marketing, user intents from search queries have been categorised into informational, navigational and transactional. While Google’s market research and insights project classified these intents into four: i-want-to-know, I-want-to-do, I-want-to-go and I-want-to-buy. I believe these classifications are a means to an end and not necessarily the intent. Example, if a user types the query ‘£20 Gyms memberships in London.’ Based on conventional classifications, this query would be viewed as a transactional or I-want-to-buy intent. I think the main intent could be losing weight to feel healthy and save for the mortgage. The motivation behind queries should be the main or higher-order intent. This type of graph will depend on other types of graphs such as narrative, interest, social and consumption graphs. A lot of the other types of graph exist in walled gardens controlled by large tech corporations. Narratives could be the easiest way to gauge or predict the range of intents behind user queries.
8) Narrative Graph: I have come up with this type of graph due to the increasing influence of narratives such as books, Netflix series, newspaper articles, podcasts and audiobooks on our beliefs and motivation for purchasing things or visiting places. Narratives can be useful in helping us better understand the intent and commonsense knowledge graphs.
The above are the different types of graphs that can be utilised by a company to provide a richer and more personalised online experience for users.